Some of you have reached out asking about the housing wealth illustration you received—specifically those ABCD columns and what they actually mean. So let me walk you through it quickly. Once you get the hang of it, the whole thing makes a lot more sense.
Here’s a short video I made that may help:
The Foundation: How Are Reverse Mortgage Benefits Calculated?
Everything starts with a simple formula, and it’s built on three things:
Age of the youngest borrower – The older you are, the more benefit you typically qualify for. It’s actuarially based.
Appraised value of the home – Higher home values may provide more available funds, up to lending limits.
Expected interest rate – This is the long-term projected rate, not your current rate. It helps determine how much the lender is willing to offer.
These three inputs go into a formula and produce your available benefit amount—what I call the number in the middle of the triangle.
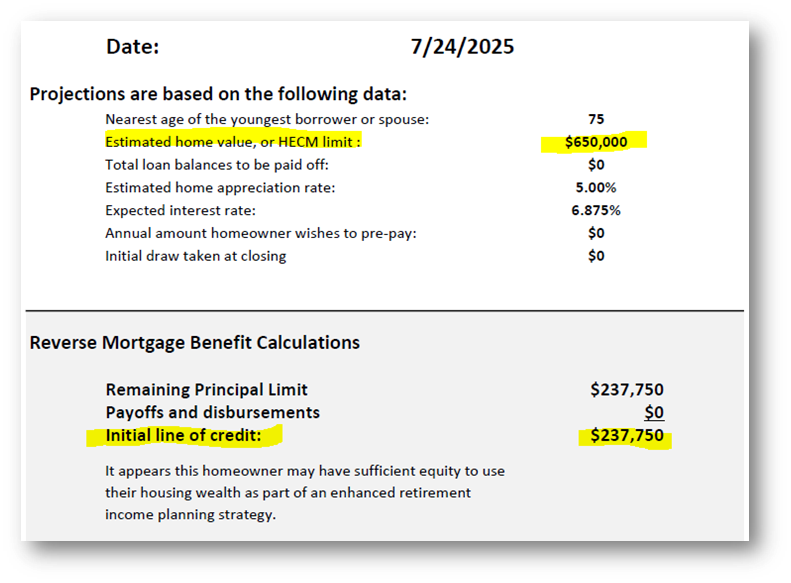
Let’s say you’re 75 years old, with a $650,000 home and an expected rate of 6.8875%. That combination might produce about $237,000 in available reverse mortgage funds.
But Wait—We Have to Subtract First
A reverse mortgage must be the first mortgage on your home. So if you still owe money on your current mortgage, that needs to be paid off first. That amount is subtracted from the $237,000, and what’s left becomes your usable benefit.
That remaining portion typically becomes a growing line of credit, which brings us to the illustration.
Let’s Decode the Columns: A, B, C, and D
This is where most people get curious—or confused. Here’s what each column represents:
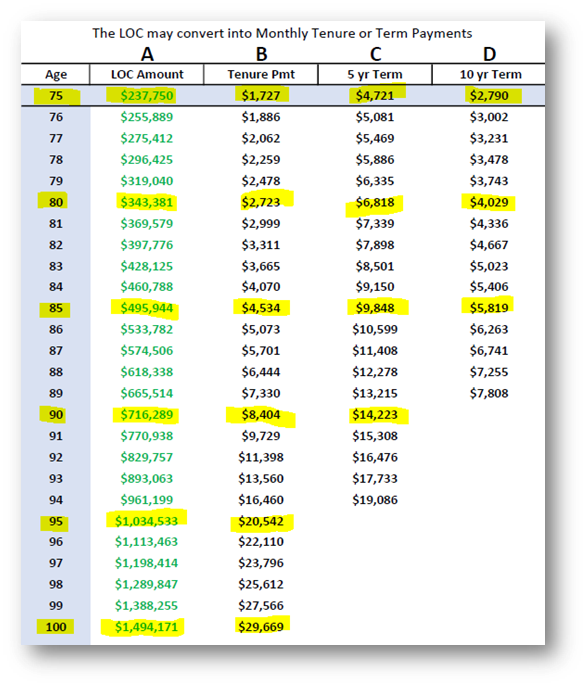
Column A: Growing Line of Credit
This is the unused portion of your reverse mortgage that’s set aside and grows over time. In our earlier example, if you don’t tap into the $237,000 right away, that amount increases. By age 85, it might grow to $495,000. Why? Because the line of credit grows at the same rate as your loan balance—creating future flexibility.
Column B: Lifetime Monthly Payments (Tenure Option)
What if you don’t want a line of credit? What if you prefer a predictable monthly check for as long as you live in the home? You can convert your line into a lifetime monthly payment. In this case, that $237,000 might translate to about $1,727/month for life.
Column C: 5-Year Term Payments
Instead of lifetime income, maybe you only need money for a set period—like five years. You can elect to receive $4,721/month for 60 months, after which the payment stops.
Column D: 10-Year Term Payments
Want the money to last longer—say, 10 years? In that case, you’d receive about $2,372/month for 120 months.
The Power of Optionality
This flexibility is what makes reverse mortgages different. You’re not locked in. Let’s say you do let the line of credit grow and now, at age 85, it’s nearly $495,000. You can now revisit the same options:
- Convert that balance into $4,534/month for life
- Or choose $9,848/month for 5 years
- Or $5,819/month for 10 years
All without having to move, sell your home, or tap into your retirement savings.
Final Thought
This isn’t just a loan. It’s a planning tool. And whether your client wants lifetime income, a short-term payout, or a rainy-day reserve, the illustration helps you see what’s possible. The columns are just different ways to unlock the same equity, based on what matters most to the household: flexibility, cash flow, and control.
If you or your clients want help interpreting your own illustration—or you’d like one tailored to a specific scenario—just reach out.
Let’s keep the conversation going.
—Don